Showcase: Data Visualization Reveals Extent of Detroit’s Arson Epidemic
April 1, 2015

Arson is taking a heavy toll on the city of Detroit over the last few years. In an effort to uncover the true impact of arson on the city, The Detroit News spent three months researching arson reports, obtaining data from multiple sources under the Freedom of Information Act. The results of the investigation were recently published in a special reporting series that included a Caspio-powered online database of approximately 9000 suspicious fires.
Not only does the online database unveil historical arson data available to the public for the very first time, it also provides a powerful tool for Detroit citizens to see which areas of the city have been hit the hardest.
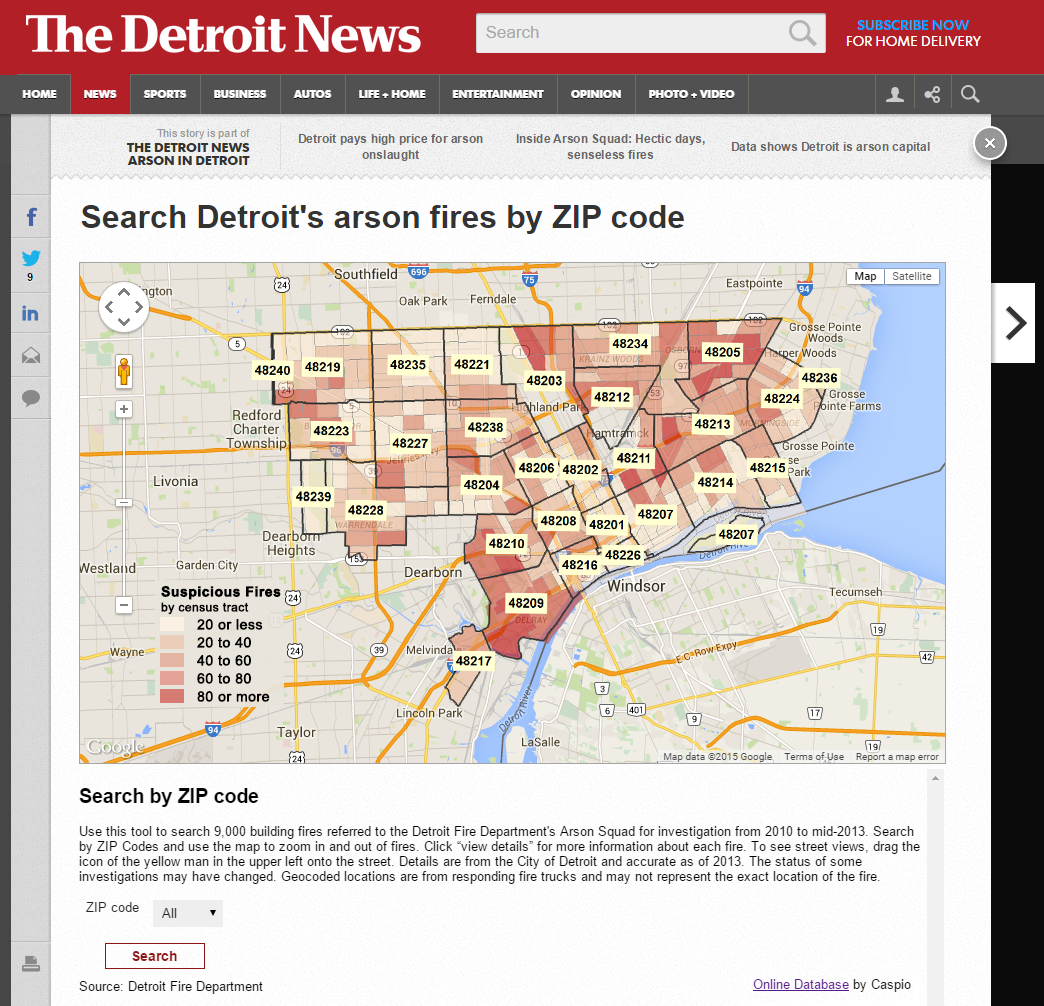
The Detroit News’ digital team wanted to create an interactive application that visualized the number of arsons across different regions in the city, so they imported the fire records into a Caspio database and added a Google map overlaid with a heat map. Readers can search the database either by clicking on a ZIP code on the heat map or by using a dropdown field under the map.
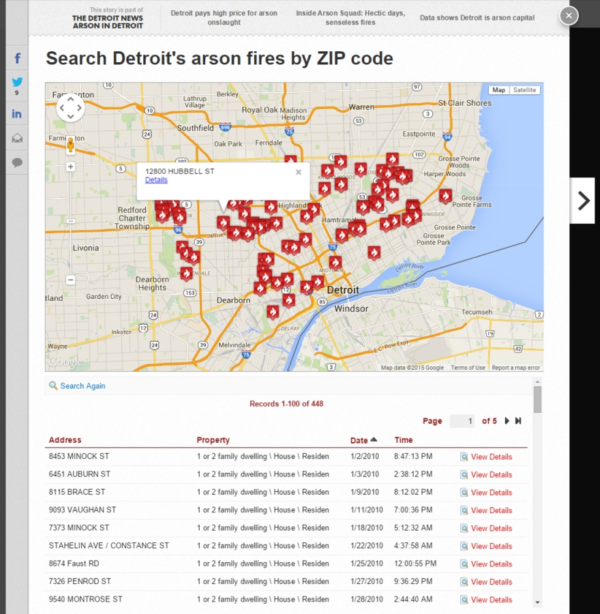
Once the ZIP code is selected, the fire incidents are plotted on the Google map for the reader to drilldown to see the details of each incident.
The online database application was spearheaded by Tom Gromak, Director of Digital Innovation, and Christine MacDonald, Investigative Reporter at The Detroit News. Using Caspio, they were able to consolidate the raw data into a searchable database and quickly add mapping features.
Caspio’s online database allowed us to go beyond simply presenting a static image. The data visualization allows our readers to drill into their own communities to see the numbers of arsons, the causes, and in some cases, the results of the investigation.
Director of Digital Innovation
The Detroit News
Gromak and MacDonald built the application themselves and kept adding more functionality throughout the process. Once the data was imported into Caspio, they created a searchable database using the point-and-click wizards and integrated it with Google Maps using Caspio’s map mashup. For the heat map, they used ArcGIS to generate the image and displayed it as a transparent layer on top of the Google map. The app was then configured to pass parameters so that the ZIP code is passed from the image map to the results page. Caspio’s map mashup also helped them add more enhancements such as the custom “fire” pins displayed on the map.

Tom Gromak, Director of Digital Innovation at The Detroit News
“Caspio has really enhanced our reporting, and I know we’re only scratching the surface of the platform.”
If you have an upcoming database or mapping project you would like to test out using Caspio, sign up for free trial and request a free project consultation with a product specialist.
For more information on Caspio’s map mashup, watch the video tutorial and read the how-to article for step-by-step instructions.


Recommended Articles

Best Quickbase Alternative for No-Code Apps in 2026
READ STORY
10 Must-Have Features Every Custom CRM Should Include
READ STORY
Modern Employee Portal Software for Enterprise
READ STORY
How to Build a Member Portal Using Low Code
READ STORY
Best Zoho Creator Alternative Without Per-User Pricing
READ STORY
HIPAA Database Software: How to Choose a Compliant Platform
READ STORY
Enterprise Features at Mid-Market Prices: How Low-Code Changed the Game
READ STORY
Caspio vs. Airtable: Which No-Code Platform Is Right for Your Business?
READ STORY
Custom CRM: How to Build a CRM That Fits Your Business
READ STORY
How to Write Better AI Prompts in Caspio's AI-Powered GPT Connect
READ STORY
The 80/20 Modernization Strategy Using Low Code
READ STORY
Introducing the Caspio MCP Server
READ STORY