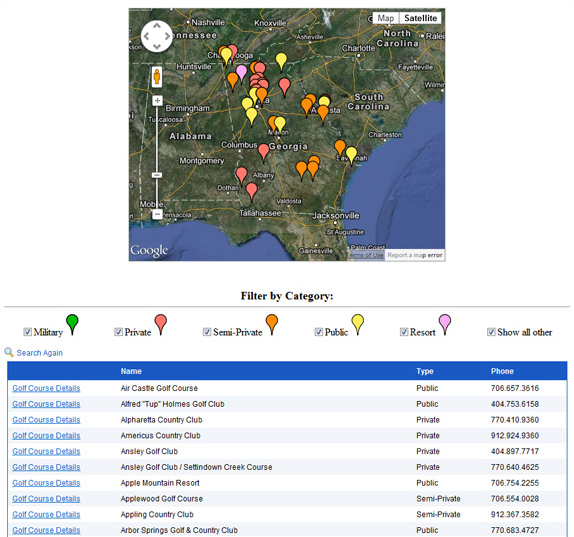
Announcing the New and Improved Map Mashup – Version 7
June 19, 2012

We have just released Caspio Map Mashup version 7. The new mashup is a step-by-step wizard that generates ready-to-deploy code. Many of the frequently requested features are included and can make your maps a lot more interesting and feature-rich.
Background
If you have never used a Caspio Map Mashup before, you may be interested to know that you can integrate your Caspio Search and Report DataPages with maps to plot address-centric records and geo-tagged data. There is no better visual for location-based data than a map. Now creating such visualization is easy.
New Features
This release is primarily driven by your feature requests. Existing Map Mashup users will be pleased to know that the following new features are now supported:
- Plot data from multiple DataPages on the same map
- Use different marker icons for each DataPage or groups of data
- Customizable information window (map bubble)

The top requested feature has been the ability to use different marker icons for each criteria or category. This capability is now implemented. For example, if you are plotting for-sale properties, you can show a different icon for houses in each price range.
You can also let users show or hide categories of markers. If you are plotting a database of restaurants, you can let users hide or show markers based on their preferred restaurant type, for example, hide all except Chinese and Italian restaurants.
Our Map Mashup continues to reside outside Caspio due to Google’s terms of use. Make sure you are familiar with Google Maps usage rights.
Try It Out for Yourself
To get started, prepare your Search and Report DataPage and then go to libs.caspio.com/mapmashup and login with your Caspio account credentials. The wizard steps are self-explanatory and a brief online help is also available. If there’s a particular feature you would like to see added to the Map Mashup, be sure to add it to the Caspio Ideabox.


