3 Data Visualization Methods for Web Applications
October 9, 2014

 It is often said that an image is worth a thousand words. This is especially true in today’s business environment where employees are swamped with data every day. Presenting information using data visualizations instead of static rows and columns is far more effective for quickly analyzing metrics, trends, and issues.
As the leading cloud platform for creating data-driven applications without coding, Caspio provides several data visualization methods for users to spice up their online database applications.
1. Charts and Graphs
Using Caspio’s Charts DataPage, you can present static data in various graph formats (bars, pies, lines, spines, etc.). Furthermore, you can create multi-page applications and configure the application with an interactive search query to filter data. As in the Feedback Management application template shown below, you can filter the data by category and the chart automatically updates based on the selected category.
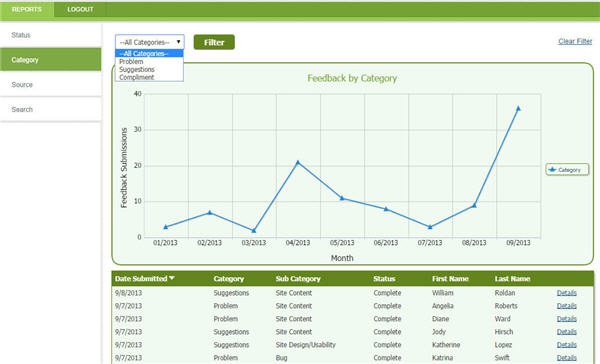
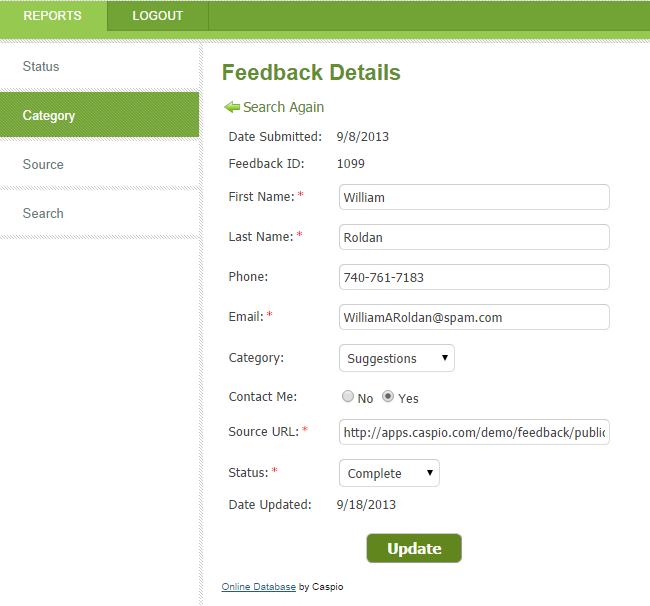
As with all Caspio reports, you can also enable a Details Page for users to drill down to any record.
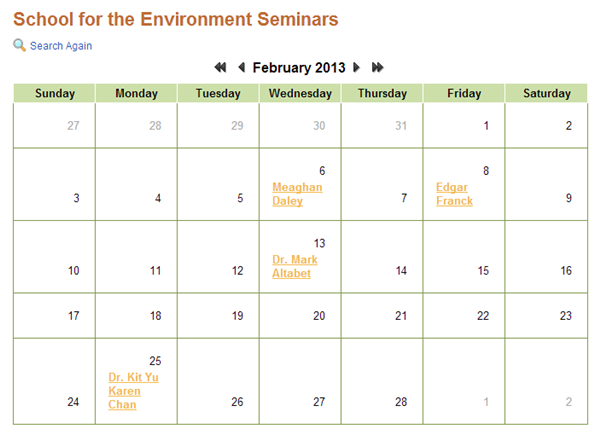
2. Calendars
Calendar DataPages are ideal for date-centric information such as an event calendar. You can easily display the data in a monthly or weekly layout and add a Details Page for users to get more information.
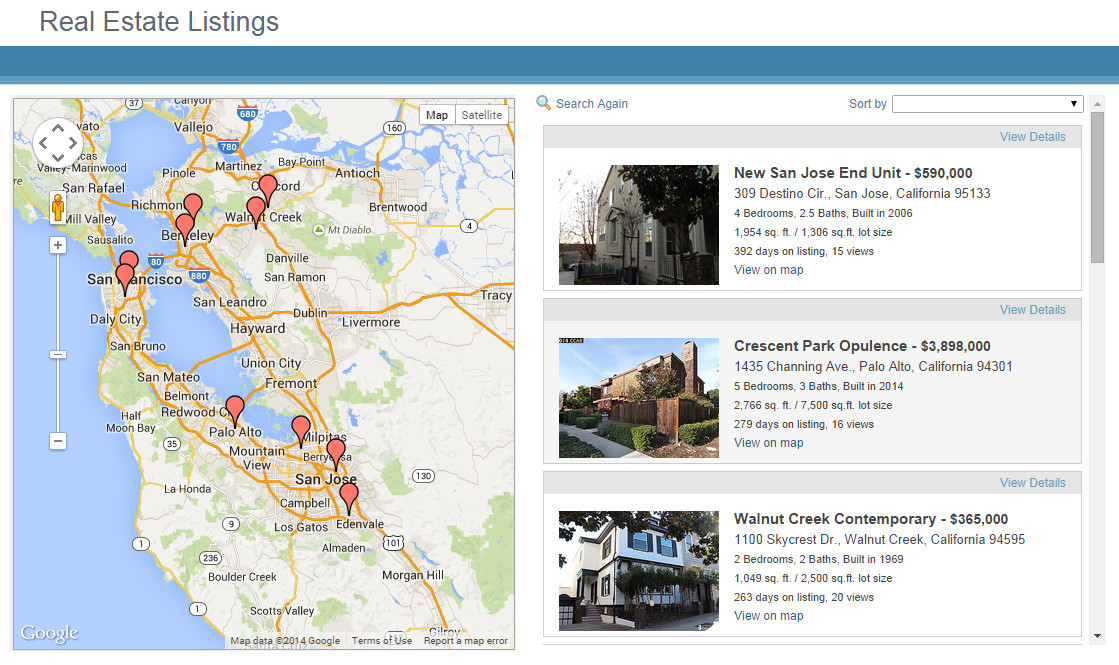
3. Mapping
If you have geo-centric data such as street addresses, Caspio’s Map Mashup allows you to easily integrate your data with Google Maps. You can plot the data from your Caspio DataPage, customize the application’s look and feel, and determine how you want users to interact with the data and the map. For example, users can drill down to the Details Page for any record by clicking from the data listing or the map bubble.
Organizations are increasingly relying on data visualizations to monitor, track and analyze information as critical part of their day-to-day operations. To explore how you can turn static data into interactive visualizations, sign up for a Caspio free trial.


Recommended Articles

Top Blaze.tech Alternatives for Business Apps in 2026
READ STORY
Custom Customer Portal Software for Growing Businesses
READ STORY
Best MS Access Alternatives in 2026
READ STORY
No-Code Platforms That Support FERPA Compliance
READ STORY
Introducing AI Solutions in the Caspio Marketplace
READ STORY
Best Quickbase Alternative for No-Code Apps in 2026
READ STORY
10 Must-Have Features Every Custom CRM Should Include
READ STORY
Modern Employee Portal Software for Enterprise
READ STORY
How to Build a Member Portal Using Low Code
READ STORY
Best Zoho Creator Alternative Without Per-User Pricing
READ STORY
HIPAA Database Software: How to Choose a Compliant Platform
READ STORY
Enterprise Features at Mid-Market Prices: How Low-Code Changed the Game
READ STORY